2022-05-11 08:19:45 -07:00
# Apache HTTP server mixin
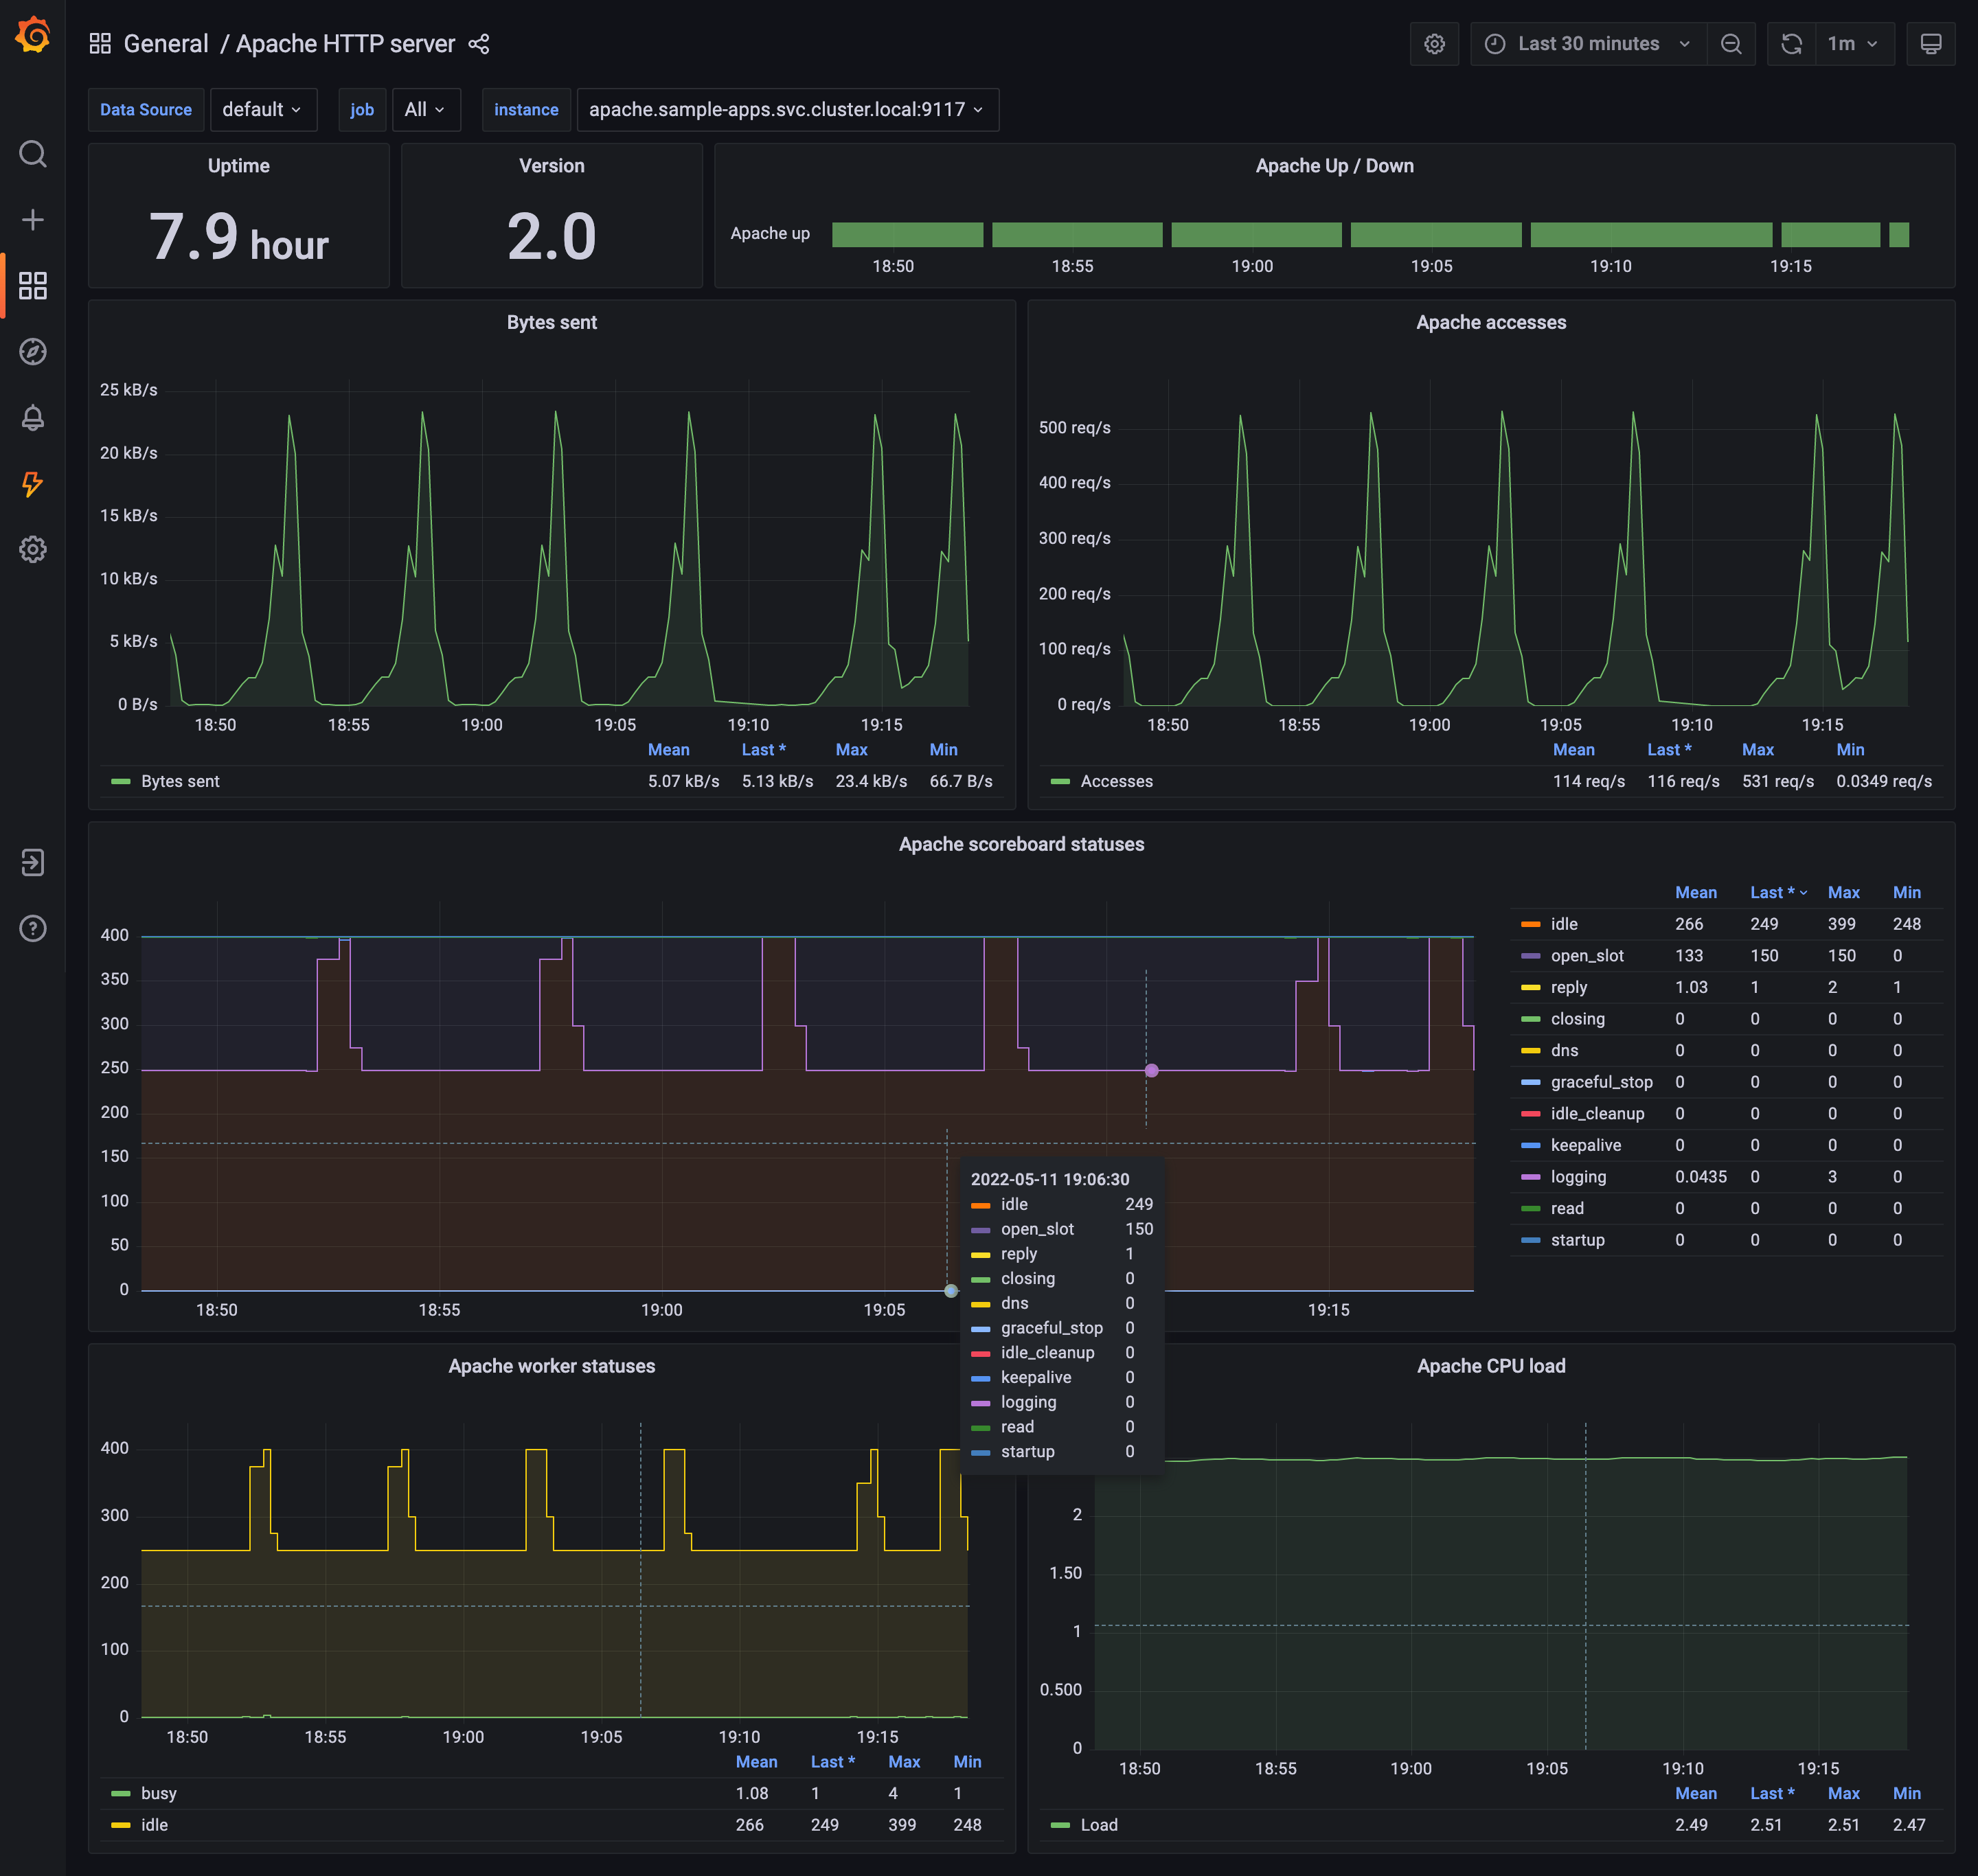
Apache HTTP mixin is a set of configurable Grafana dashboards and alerts based on the metrics exported by the [Apache exporter ](https://github.com/Lusitaniae/apache_exporter ).
2022-05-11 10:47:39 -07:00
## Install tools
2022-05-11 08:19:45 -07:00
```bash
go install github.com/jsonnet-bundler/jsonnet-bundler/cmd/jb@latest
go install github.com/monitoring-mixins/mixtool/cmd/mixtool@latest
```
For linting and formatting, you would also need `mixtool` and `jsonnetfmt` installed. If you
have a working Go development environment, it's easiest to run the following:
```bash
go install github.com/google/go-jsonnet/cmd/jsonnetfmt@latest
```
The files in `dashboards_out` need to be imported
into your Grafana server. The exact details will be depending on your environment.
`prometheus_alerts.yaml` needs to be imported into Prometheus.
2022-05-11 10:47:39 -07:00
## Generate dashboards and alerts
2022-05-11 08:19:45 -07:00
Edit `config.libsonnet` if required and then build JSON dashboard files for Grafana:
```bash
make
```
2022-05-11 10:47:39 -07:00
## Import dashboards and alerts using Grizzly tool
Install grizzly first: https://grafana.github.io/grizzly/installation/
Set env variables GRAFANA_URL and optionally CORTEX_ADDRESS (see for [details ](https://grafana.github.io/grizzly/authentication/ )).
Then run to actually import the dashboards and alerts into Grafana instance:
```bash
make deploy
```
2022-05-11 08:19:45 -07:00
For more advanced uses of mixins, see
https://github.com/monitoring-mixins/docs.